Comreg’s latest quarterly report, published just before Christmas, makes for interesting reading. Here, in aid of brevity given the evening that’s in it, are some observations on the report and what it means for us in the Irish telecomms industry:
- Telecoms is still getting cheaper – see chart 1.4.1. This is probably driven by quad-play, in part, but we await the next quarterly report to see whether prices continue to decline with the consolidation in the mobile industry. This tallies with Figure 4.5.1 which shows that mobile ARPU continues to fall.
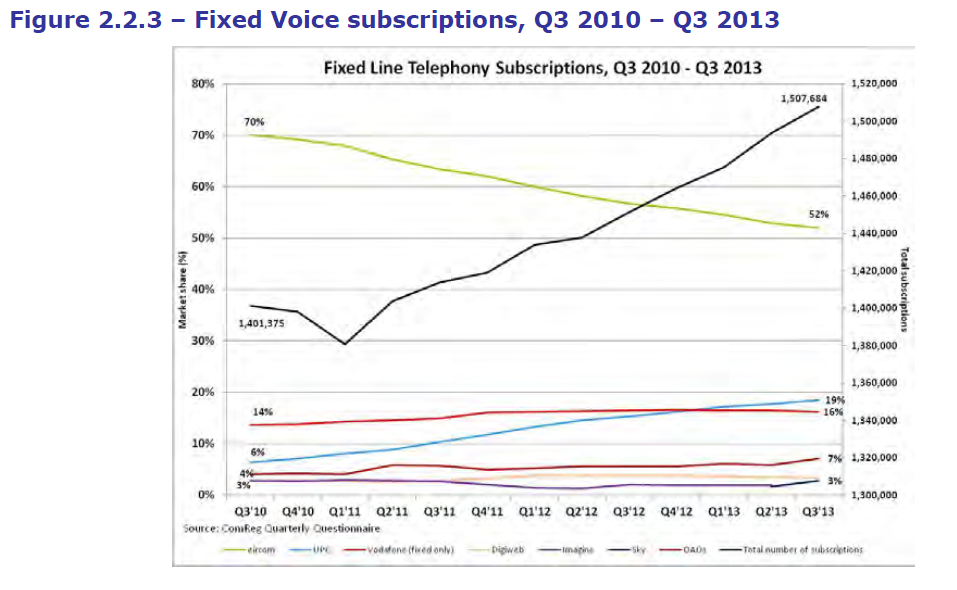
- Eircom’s loss of fixed line market share continues, albeit at a reduced rate. It is too early to say whether Eircom TV is starting to arrest the decline. Certainly, as chart 2.2.3 below shows, most of the growth in fixed-lines seems to be coming from UPC. This is backed up by the growth in triple-play services shown in graph 2.2.4. Apologies for the poor quality graphic – the original (here) is a little more legible, though still hard to read.

Green = Eircom, light blue = UPC, orange = Digiweb, red = Vodafone (fixed), purple = Imagine, dark blue? = Sky, maroon = OAOs & black = total subscriptions (right axis)
- Chart 3.1.2 shows that fixed broadband is substituting for mobile broadband. Overall growth in broadband penetration seems to have plateaued – surely have we not reached saturation? Chart 3.3.1 shows that Ireland is well below the European average on broadband penetration, and the days are gone when one could argue that household size was a significant factor there. This is a real issue – how can Ireland become a knowledge economy if we don’t get the people using computers? Some of the research findings suggest that home broadband in Ireland is expensive (fig 3.5.1), whereas other charts suggest that price is not the main issue. However, according to research published elsewhere, our broadband is also too slow. Research published here shows that Irish broadband upload and download broadband speeds are towards to bottom of the list of European countries.
And what of mobile?
- For the first time in a long time, the proportion of postpaid (vs. prepaid) subscriptions fell, albeit slightly – as evidenced in fig 4.2.1. Are consumers or operators pulling back from great deals on postpaid smartphones at the bottom of the market?
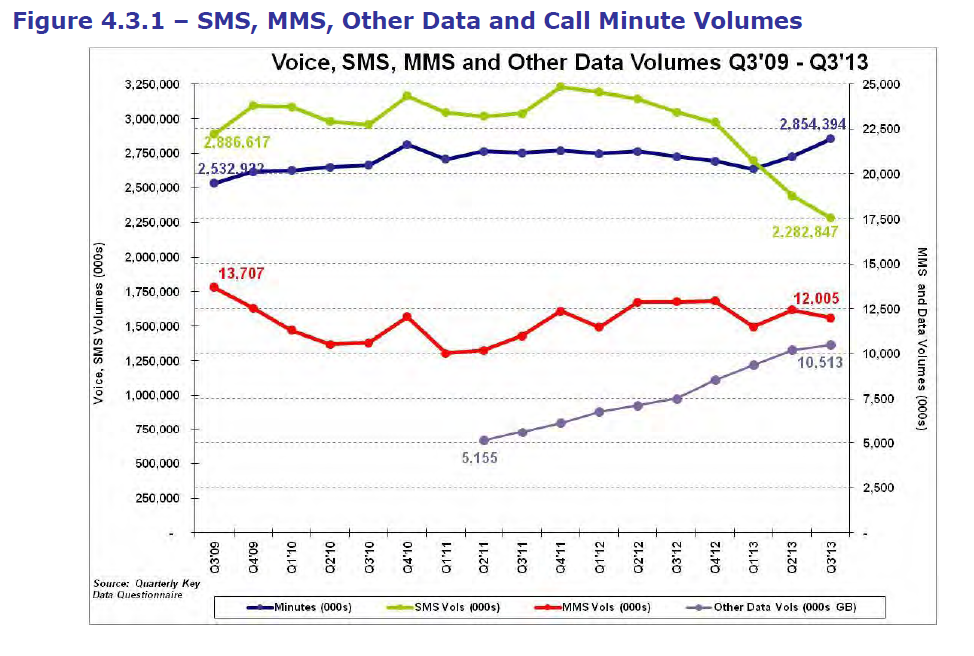
- Chart 4.3.1 below tells an interesting story. It will come to no surprise to telecoms heads that SMS volumes are falling through the floor as Over-The-Air (OTA) services grow. Whatsapp has over 400 Million users! Of course, mobile data volumes are growing fast – they almost doubled in the last 2 years, as the chart shows.
- Chart 4.3.5, when taken with 4.3.1 above, shows that the growth in mobile data volumes comes from both the number of users and the volume per user. No surprise there.
- Comreg are doing a good job of keeping us abreast of the new field of machine-to-machine (M2M) communications. Figure 4.6.1 shows that Vodafone and O2 have most of the market between them.
- Fig 4.3.2 shows the breakdown of mobile outgoing calls. Another first for Q3 2013 – the volume of mobile international and roaming calls outstrips that of mobile to fixed numbers for first time. So punters are taking fixed lines (2.2.3, above) but they’re probably not giving the numbers out, and if they are, their friends are electing to call them on the mobile.
- Figure 4.3.4 shows that about ⅔ of mobile voice minutes are on-net. Research has shown that people tend to choose the same network as their social group – this phenomenon is much more marked in countries (e.g. Portugal) where the price advantage for calling on-net is stronger.
Overall, another interesting report and a couple of firsts for this quarter. One request to COMREG, please: can you publish the report as a higher-resolution pdf please? Some graphics (e.g. 2.2.3) are difficult to read.
Happy New Year to all!

